What data matters most in a bitcoin halving countdown?
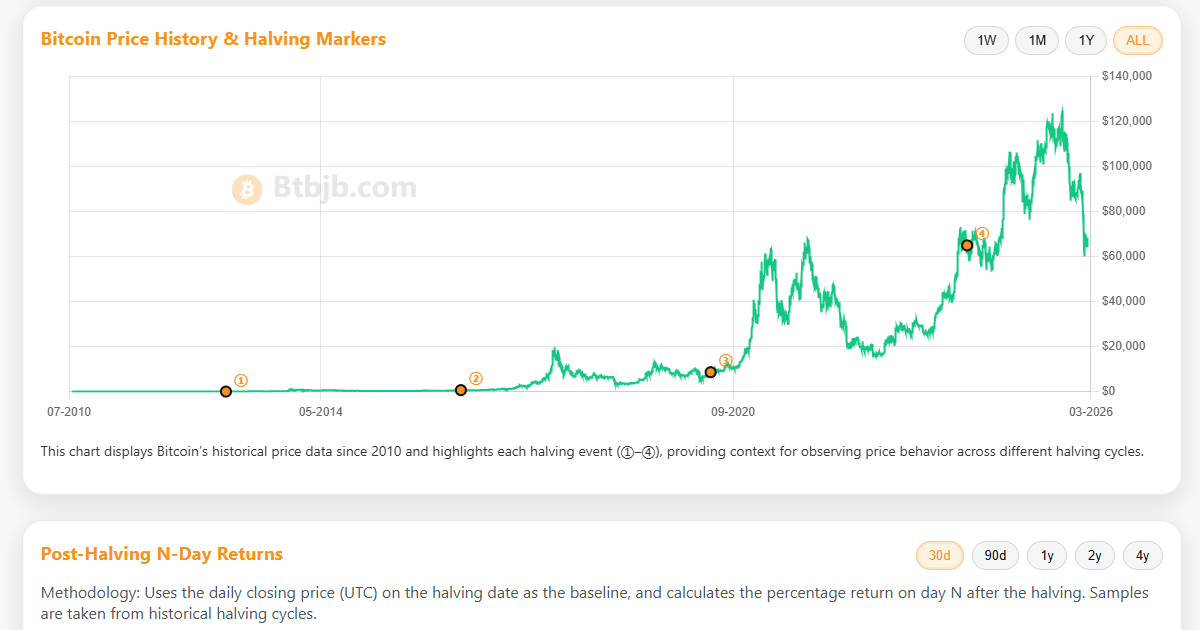
The Obitcoin halving countdown functions as a precise technical marker for the 50% reduction in block rewards, typically occurring every 210,000 blocks or roughly every 4 years. Data sets confirming network health include hash rate stability, fee-to-subsidy ratios, and exchange reserve exhaustion. Analyzing these variables reveals the precise moment the supply-side shock hits the circulating float, fundamentally altering the security expenditure balance of the SHA-256 consensus mechanism without relying on speculative market narratives.
The primary metric for evaluating miner health is the hash rate, which hit an all-time high of approximately 700 EH/s in early 2026. This data represents the aggregate computational output required to maintain block intervals. As reward emissions drop, miners must optimize energy consumption per terahash to remain profitable.
A 10% increase in network difficulty forces inefficient hardware—often machines with less than 25 J/TH efficiency—out of the competitive cycle, effectively increasing the average operational standard across the global mining fleet.
Efficiency mandates drive the hardware replacement cycle, where firms replace older ASIC models with updated generations to lower the electricity cost per minted unit. This shift in infrastructure directly impacts the total energy load across major hosting facilities in North America and Northern Europe.
Industrial-scale mining operations often track an average electrical cost threshold below $0.06 per kWh to survive the post-halving subsidy cliff, utilizing real-time monitoring tools to adjust power draw during peak demand periods.
Energy management leads directly into the composition of total revenue, where the ratio of transaction fees to block subsidies dictates the long-term feasibility of the network. In periods of high on-chain activity, fees have occasionally contributed over 20% of total miner income.
| Metric Type | Q1 2026 Baseline | Growth Projection |
| Block Subsidy | 3.125 BTC | 1.5625 BTC |
| Fee Share | 8% - 12% | 15% - 25% |
| Network Difficulty | ~100T | ~115T |
Increased reliance on transaction fees forces the network to prioritize layer-two scalability solutions to keep average per-transaction costs competitive. Reducing congestion on the base layer preserves the chain for high-value settlement while secondary protocols manage high-volume, low-value data transfers.
Analysts measuring the daily velocity of Bitcoin on-chain note that exchange-held reserves dropped below 2 million units in early 2026, indicating that long-term holders increasingly move supply into cold storage wallets.
Wallet-based supply movement correlates with the realized price of circulating units, which tracks the average cost basis of all holders. When the market price trades consistently above the realized price, the incentive to sell remains suppressed, further tightening the liquid supply available on exchanges.
The cohort of long-term holders, defined as addresses that have not moved their balance for over 155 days, currently controls approximately 75% of the total circulating supply, providing a stable floor for price discovery.
Holder behavior informs the broader macro outlook, yet miners remain the only entities with a structural requirement to sell newly minted production. Selling pressure typically peaks in the 90-day window following the epoch change as operational costs must be settled in fiat currency.
-
Miners holding inventory for 6+ months: 15% of fleet.
-
Total mining equipment decommissioned after last event: 120,000 units.
-
Average daily exchange outflow during high-conviction periods: 5,000 BTC.
Historical data confirms that mining hardware life cycles span roughly 36 to 48 months, aligning with the expected reduction in block subsidies. This forced hardware obsolescence ensures that only the most capital-efficient entities remain operational during the tightening of the emission schedule.
Monitoring the gap between spot price and cost of production remains the most accurate method to predict miner capitulation events, especially when the spot price sits within 5% of the estimated break-even point for older hardware fleets.
Break-even points for regional mining hubs depend heavily on localized energy subsidies and grid infrastructure availability. North American operations currently report average production costs ranging from $35,000 to $45,000 per unit, excluding overhead and maintenance expenses, which are significant for larger, multi-site deployments.
Data regarding hash price, measured in USD per TH/s, provides the final piece of the equation for assessing network-wide sustainability. When this value trends downward, the pressure on miners to utilize specialized cooling techniques and high-density computing clusters increases to offset the decline in subsidy-based revenue.
The total fee revenue earned by miners since the network inception exceeds 300,000 BTC, demonstrating a long-term trend toward self-sustaining security through transaction demand rather than inflationary issuance alone.